ttaanalytics-advantage

The TTAANALYTICS Advantage.

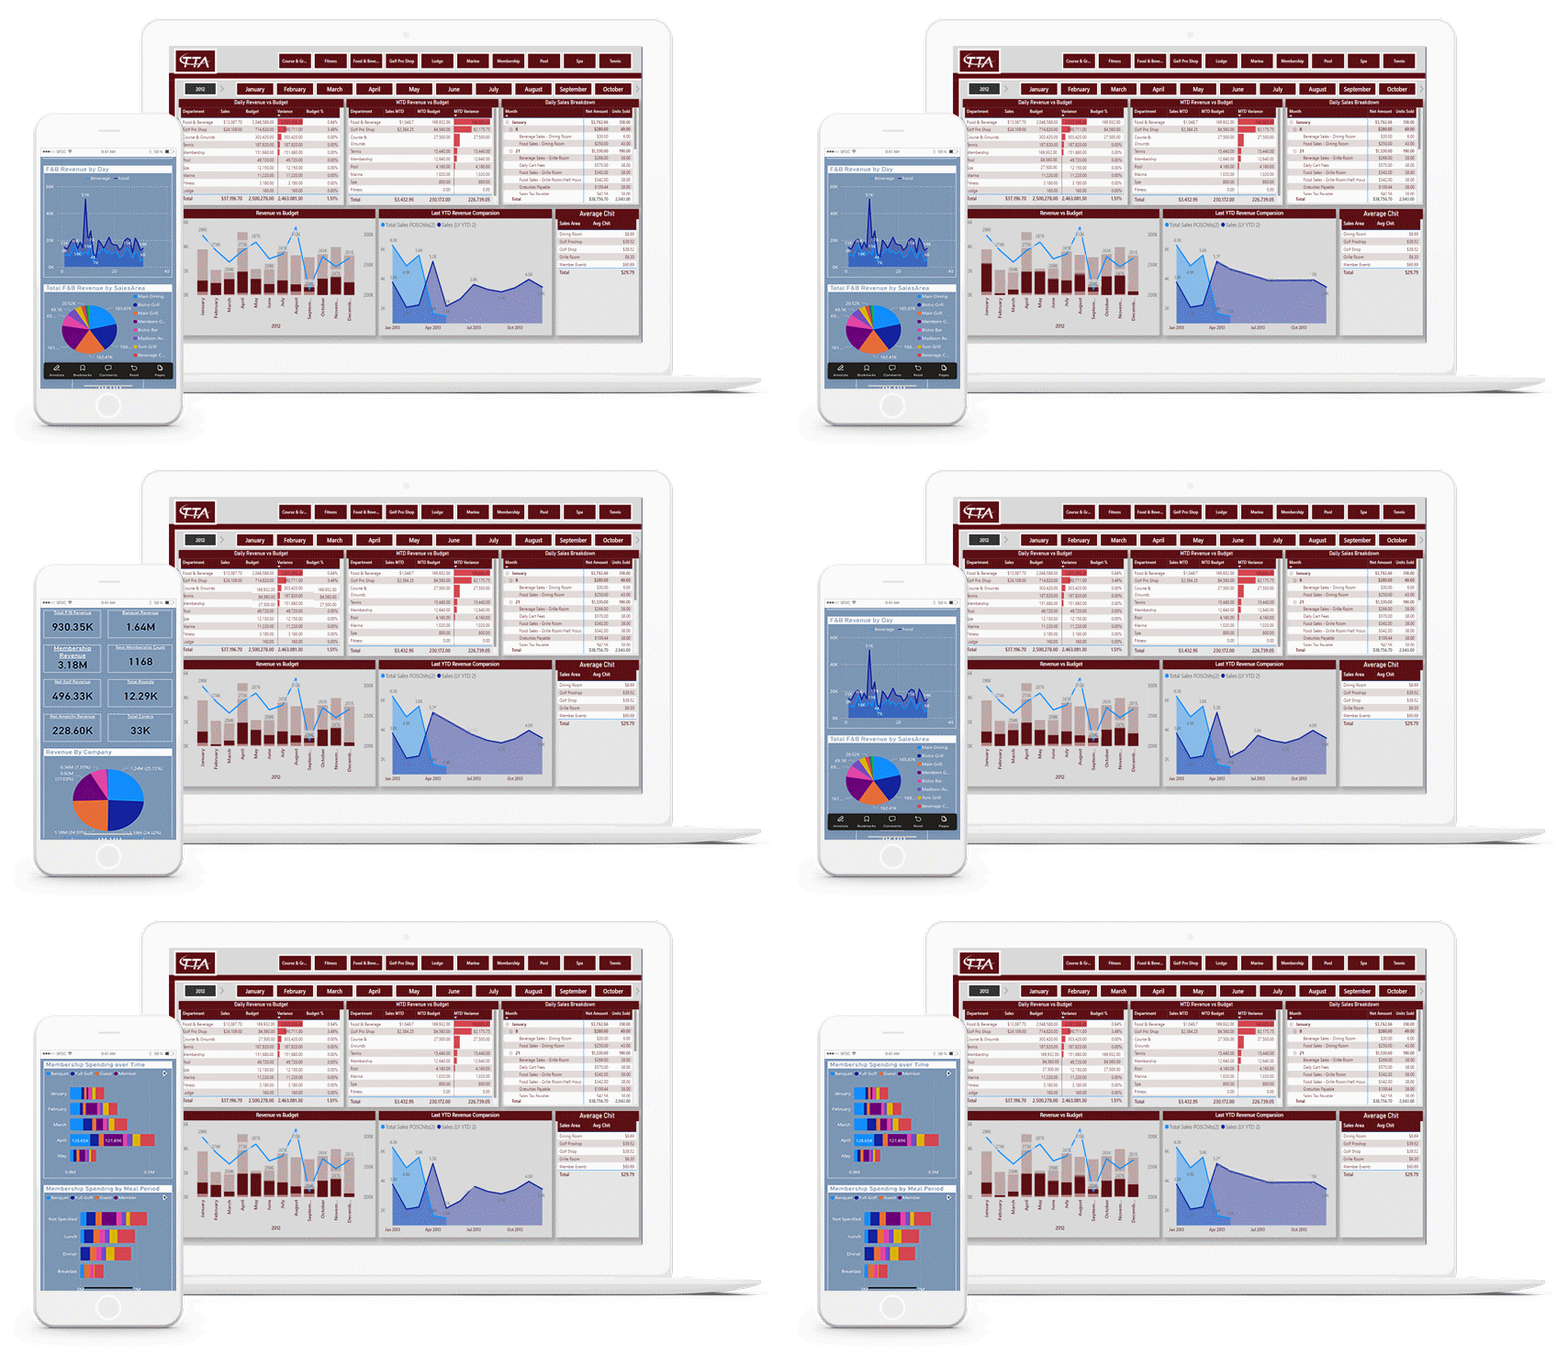
TTAAnalytics delivers a real time Business Intelligence system that allows you to organize and analyze data quickly to help you make wise business decisions. Our dashboards are automated, intuitive and scalable to your business needs.

WHAT IS BUSINESS ANALYTICS?

Business analytics refers to gathering and processing business data, everything from member demographics to cover count. Analyzing that data to identify trends and patterns can help you run your business more efficiently and give your club a better ROI.

WHY PARTNER WITH TTAANALYTICS?

• TTAAnalytics Affordable, versatile, both agile in implementation & robust in durability and stability.
• Automation & Consolidation Report generation is automated and requires no special monitoring or manual data input.
• Customization Report parameters and data can be tailored to your company’s needs.
• Our system does the work and delivers valuable Business Intelligence your team can access quickly and effortlessly.

ttaanalytics-business-analysis-plans

BUSINESS ANALYTICS PLANS

TTAAnalytics offers a selection of Business Analytics Plans to suit an array of budget and business needs. Contact a consultant at 800.474.2582 for a FREE QUOTE on a custom Analytics Plan.

STANDARD
ANALYTICS

$100/month
  • Basic Daily Sales Report for All Sales Areas
  • Data Visualization
    • Charts & Graphs
  • Covers Report

ADVANCED
ANALYTICS

$250/month
  • Intermediate Daily Sales Report for All Sales Areas
  • Data Visualization
    • Charts & Graphs
  • Covers Report
  • Rounds Report
  • Member Spending & Demographics

ULTIMATE
ANALYTICS

$500/month
  • Intermediate Daily Sales Report for All Sales Areas
  • Data Visualization
    • Charts & Graphs
    • Demographics
  • Covers Report
  • Rounds Report
  • Member Spending & Demographics
  • Financial Statements
  • Actual to Budget Comparison
virtual-cards

FREQUENTLY ASKED QUESTIONS

What is TTAAnalytics?

TTAAnalytics is a powerful analytics tool that allows you to tap into the Jonas data source and transform and visualize data. It is easy to share insights through interactive reports and dashboards.

What is an Analytic Dashboard?

An analytic dashboard in Power BI is a visual representation of key metrics and data insights that provide a comprehensive view of your business data. It combines various visualizations, such as charts, graphs, tables, and maps, to present data in a way that is easy to understand and interpret.

Can I access these reports on a mobile device?

Absolutely! A mobile application is available for iOS and Android devices, allowing you to interact with your dashboards on the go. The mobile app provides a responsive and optimized viewing experience, and you can also receive notifications and alerts based on the data in your dashboards.

How up to date are the analytics?

The dashboards can display real-time data as it comes in.

Can I automate dashboard notifications?

Yes, automated daily emails containing a preview of the dashboard can be delivered to key recipients. We can also include a links with direct access to the dashboard for easy access.

How well do my current reports translate to the Business Intelligence system?

All current reports translate completely, with better readability and accessibility as well as making data input obsolete. The days of running reports, exporting to excel, and crunching numbers are over!

Is there upkeep or maintenance involved after implementation?

Software automation means no upkeep or maintenance once implemented. Changes can be made upon request.

Besides the cost of the plan what other monthly costs are incurred?

Power BI Pro or higher license is required (typically included with Office 365. We will verify to see if an upgraded license is required.). We will walk you through every step.

CONTACT TTAANALYTICS.CLUB